Myth: The best way to grow the economy is to give tax breaks to the wealthy and corporations.
Although its defenders allege there is more to supply side economics than reduction in income taxes, supply side policies generally revolve around the reduction of top marginal tax rates on the argument that this will generate economic growth. Unfortunately, a lot of people don’t understand the concept of marginal tax rates. Only those dollars above a statutory range are taxed at the highest rate. That is, the first $20,000 earned by a wealthy person is taxed at the same rate as someone who earns a total of $20,000. Only those dollars above the income threshold are taxed at the highest rates.
A graphical look at historical marginal tax rates in the U.S. shows that a precipitous drop in the highest marginal tax rate preceded the Great Depression. We can also see that higher marginal tax rates occurred throughout America’s post-World War II “Golden Age” (1945-1975), the years in which America ascended to international supremacy as well as the growth of a robust American middle class.
In constructing the following graphical charts, I obtained data from sources that are generally regarded as unbiased, primarily the U.S. Bureau of Labor Statistics. Because I was looking for year-over-year changes–and these numbers are generally reported as snapshots–when I had to chose a month for a particular year, I chose January. While the graphs would look slightly different if I had chosen another month, over a span of several decades, the overall trends and patterns would not be significantly different if I had chosen a different (but consistent) month during the year to pull the numbers from. What I want to emphasize is this is data that is available to anyone–no need to be a mathematician or high-paid researcher in a fancy think tank.
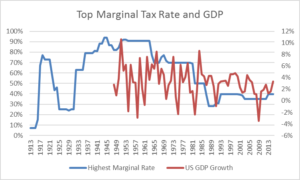
The first chart looks at the relationship between marginal tax rates and GDP. To its credit, the Washington Post published an article in April of 2016 showing data that suggests there is no relationship—or possibly a very small positive one—between higher top marginal rates and productivity, investment, per capita GDP and other growth measures. This is corroborated by my own graph below, as well as arguments generally against so-called “supply-side” propaganda from the Tax Justice Network.
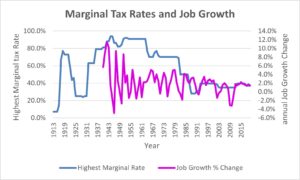
The next chart shows the relationship between the highest marginal tax rates and job growth. Here again, I obtained my year-over-year job growth data from the Seidman Institute at the University of Arizona, who also sources their data from the BLS. One can easily see that there was greater year-over-year job growth during periods where the marginal tax rate was higher, although job growth was also more volatile. There are also other possible explanations, such as a post-World War II economy. So, the most generous interpretation is that there is no relationship at all between marginal tax rates and job growth. Obviously, the data makes no distinction between good jobs and crap jobs. However, our purpose here is not to compare apples and oranges, but to refute the BS that giving tax cuts to the rich creates more jobs–any jobs.
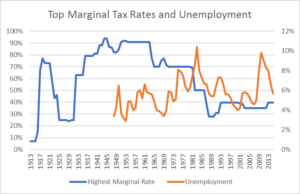
The biggest myth-buster is the connection between higher marginal tax rates and unemployment, as it is obvious from the chart below that lower marginal tax rates have led to higher unemployment. The evidence has been in for some time that tax cuts for the very rich do not ipso facto create economic growth—especially not jobs—yet the ideology continues to be perpetuated.